MT4 Webtrader: Analyze Charts & Make Your First Trade

 Twitter
  Facebook
  WhatsApp
  Linkedin
  Message
  Email
Email 
This detailed walk-through, guides you from the very basics of selecting an instrument, annotating charts and using technical indicators followed by how to place a market order and a pending order as well as managing the trades. By the end of this article, the reader will have a clear idea on how to trade with the MT4 webtrader in a step by step process.
Selecting a Symbol from the Webtrader's Market Watch
The first step after you login to your MT4 webtrader account is to look to the left, the ‘Market Watch’ window. This section lists all the instruments that are available to trade. You can customize the Market Watch window by selecting only a few instruments (to keep it clutter free), or select all instruments so they can be readily accessible. In this article, let's assume that you will be trading two instruments, a Currency instrument and a commodity instrument. Simply scroll down the Market Watch section and select a currency pair of your choice. (We will use EURUSD from Currency and XAUUSD from commodities). The chart below shows how you can customize the MT4 webtrader section to display/hide the instruments of your choice.
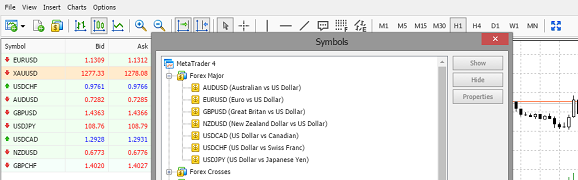
If any of the instruments are not shown in the Market Watch window, simply right-click select 'Symbols' and scroll through the list to find the instrument of your choice that you want displayed on the Market Watch section. Now, right-click on the instrument and select 'Chart Window' from the menu options or simply drag/drop the instrument to the right side panel to have the instrument's chart show up. You can now customize the chart by firstly selecting the time frame of your choice. In this example, we make use of the 4-hour (H4) time frame. The chart time frames are displayed and you can select from any, ranging from M1 (1-minute) to MN (Monthly).
Using Indicators/Drawing Tools to Analyze Charts
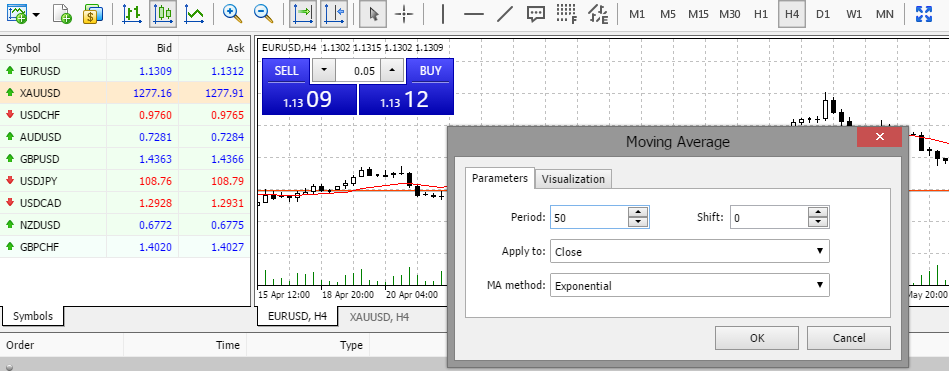
The next step is to analyze the charts. For this, we will use a mix of some drawing tools and indicators. Firstly, we will select two moving averages, 20 and 50 period EMA's. To apply the indicator on the chart, go to ‘Insert>Indicators’ and select 'Moving Average’. Make the appropriate changes to the indicator's settings and click ok.
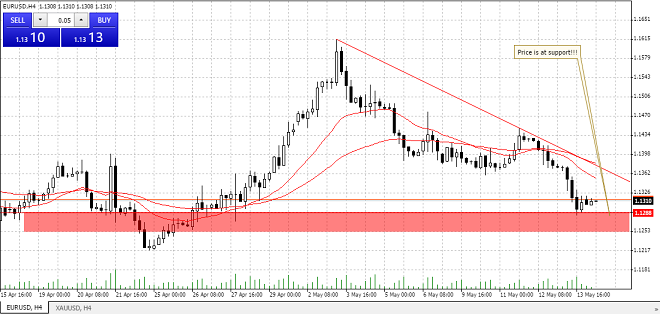
Now that the indicators are added, we can maximize the charts to get a better understanding of the markets. Just click on the 'expand’' icon that you find on the right side to make the chart full-screen, or go 'View' and uncheck 'Toolbox' to simply expand the chart. This will maximize the chart within the terminal window. You can also uncheck ‘Market Watch’ to have the browser window expand the chart. This is ideal if you want to just focus on analyzing the charts and need to maximize the chart window. We can now use some drawing tools. In this example, we make use of a 'Trend line' tool and also add some horizontal lines and make some chart annotations. All these options are found in the 'Insert' menu bar option. If you prefer to use dark theme charts, just right-click on the chart and select ‘Properties’ and use the drop down options from the ‘Color Scheme’ to switch between any of the three default screens. Further customizations can be done including hiding the grid on the chart, using the period separator option and many more customizations. The only drawback is that you cannot add your own color preferences to the charts. In the following screenshot, we make use of a rectangle tool, a trend line and a chart annotation tool.
Placing a Market Order
Now that we have completed our analysis, we will go long on EURUSD or place a Buy order at market. To place a market order, we can either use the one-click trading or click on the 'New Order' icon (second from left) .If you are using the one-click trading option then firstly check that you are using the right lot-size. You can change the lot-size value by clicking on the text box and change the value from 0.01 (micro lot) to 1.0 (standard lot). Once the order is placed, the next step is to manage the order by setting stop loss and take profit levels. To do this, we need to enable the 'Toolbox' by clicking on 'View>Toolbox'.
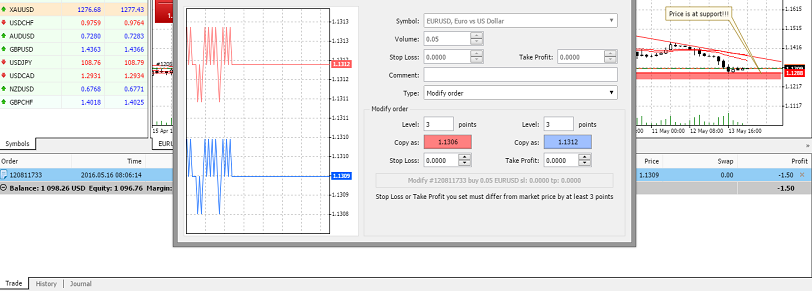
To manage your open order, right-click on the trade, and select the 'Modify or Delete' option which will open the order management window, for further modification to your open trade. Here you can enter the stop loss and take profit details and click 'Modify'.
Placing a Pending Order
On the second instrument, we'll place a pending order. To do this, go to the instrument's chart window. Right-click on the chart and select 'Trading' and choose 'New Order'. This will open the order management window.
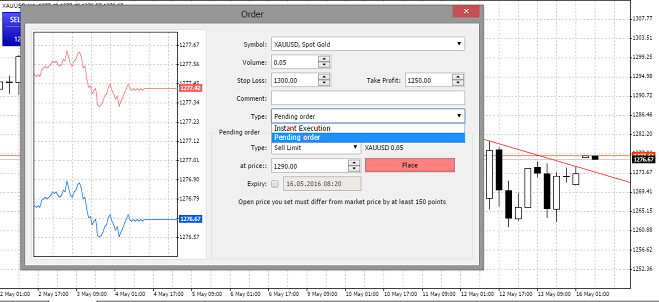
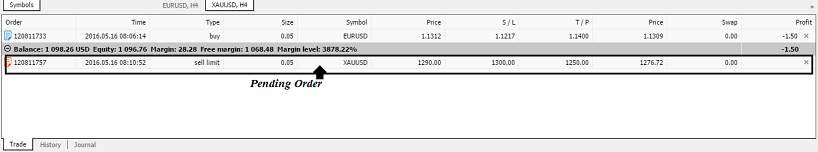
Change 'Type' from ‘Instant order’ to ‘Pending order’ and enter the trade details. In this example we are setting a Sell Limit order in XAUUSD at 1290 with stop loss at 1300 and take profit at 1250. After submitting the order, we can see that it is accepted and shown in the 'Trade' window section.
Checking Trade Performance by Looking at the Equity
Once your orders have been placed, you can check your trade performance by looking at the ‘Trade’ window. Here you can view the floating profit/loss on your open orders. You can close out the order by clicking on the ‘x’ on the extreme right, or you can right-click on the open order and select ‘Close Order.’ At any point in time you can simply switch to ‘History’ tab where you can view your past trade and transaction history on the MT4 webtrader platform. The charts that you have analyzed and annotated remain in place and you can logout of your MT4 webtrader platform and login from anywhere else, the charts remain the same. In conclusion, the MT4 webtrader platform is a versatile tool that eliminates the need of having to download the desktop version of the MT4 trading platform. You can access your trading terminal from just about anywhere and on any computer.
This article is available only to alvexo plus members, register now, and get 7 days of free membership.

Congratulations,
You are a Member!
Your Alvexo plus membership is free only for one week, to extend the membership you need to deposit funds into your account and trade with alvexo
You're Membership is expired!
Your Alvexo plus membership is expired, to extend the membership and your financial knowledge you need to deposit funds into your account and trade with alvexo